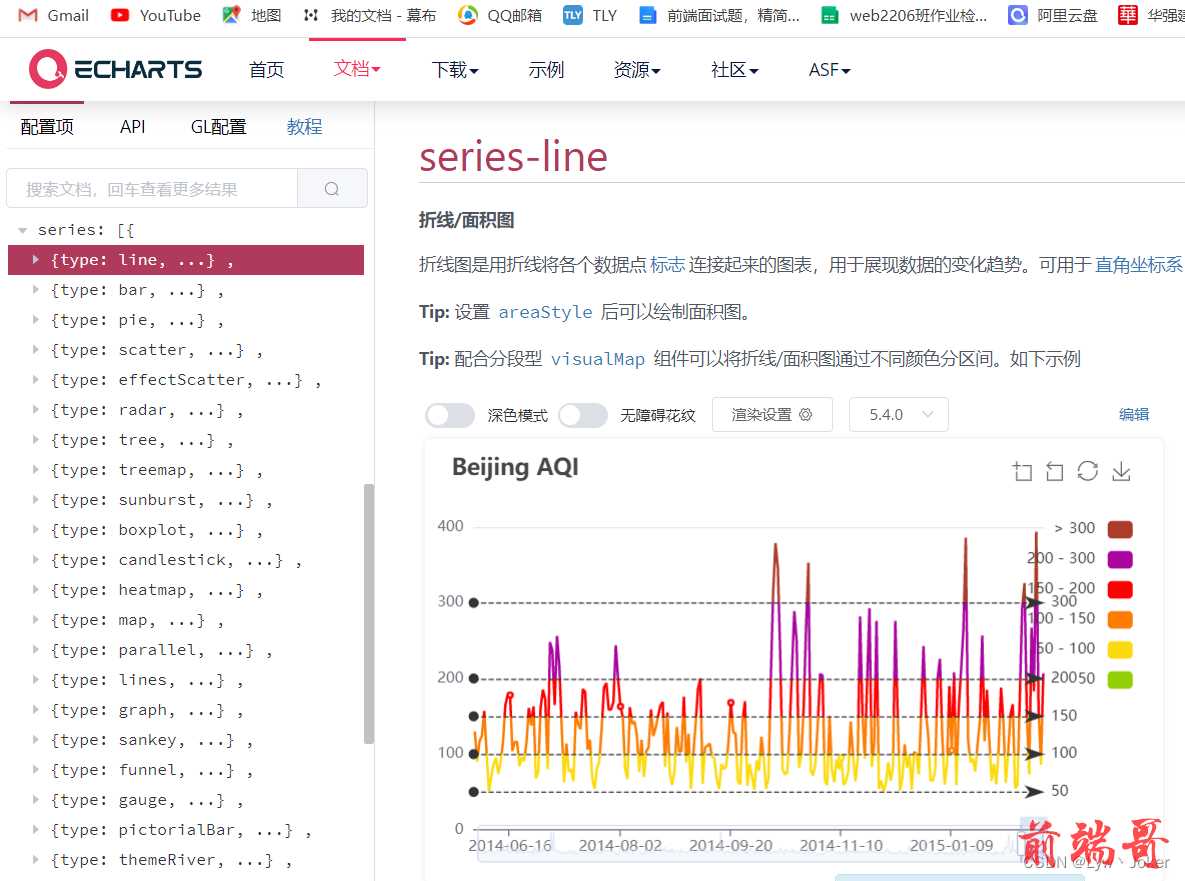
echarts
介绍
| 作用:展示图表的(大数据可视化) |
| 百度,捐给apache 免费开源 |
| 竟品: |
| heightCharts |
| D3 |
| |
术语
| https: |
| legend 图例 |
| tooltip提示 |
| xAxis x轴线 |
| yAxis y轴线 |
| series系列 |
| title 标题 |
| data数据 |
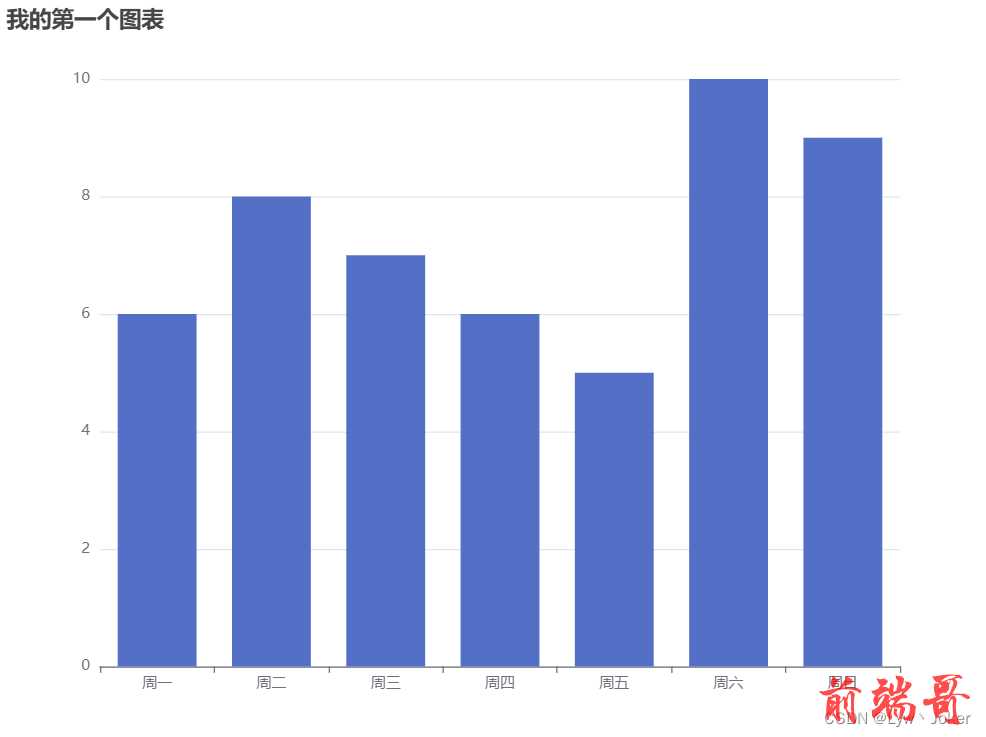
图表常见类型
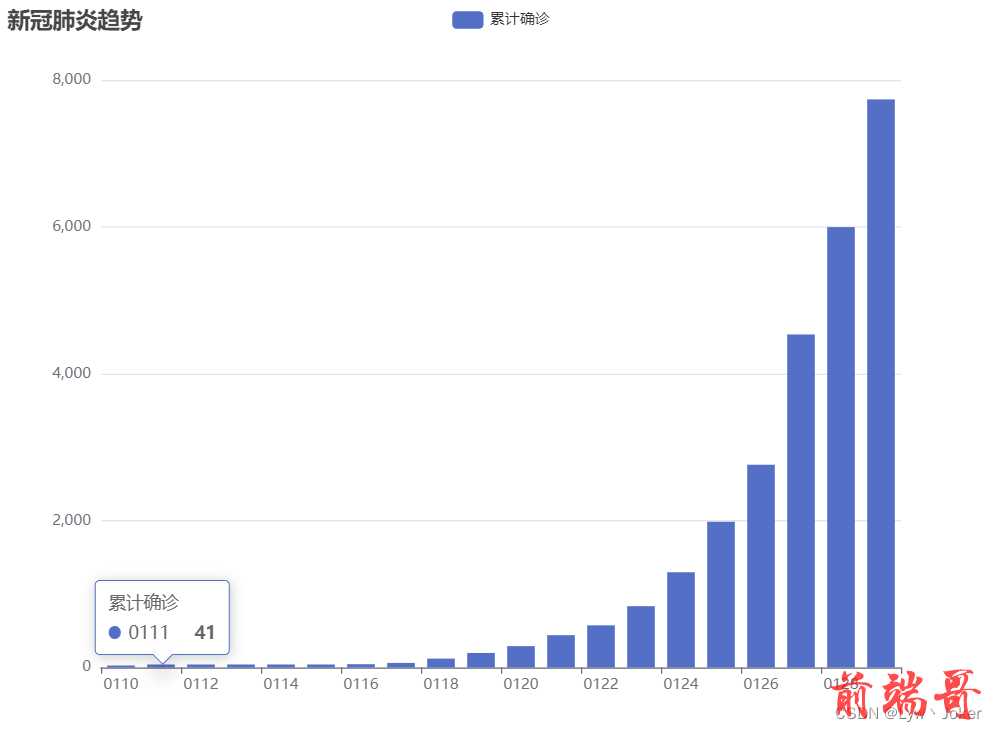
bar 柱状图
smooth:true 曲线图
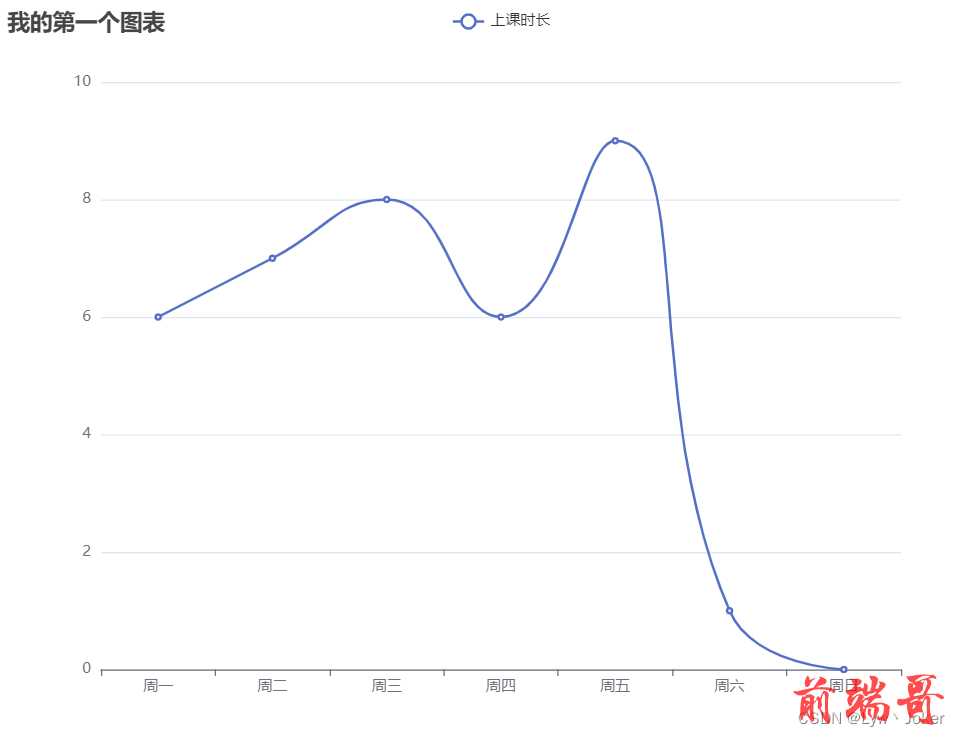
line折线图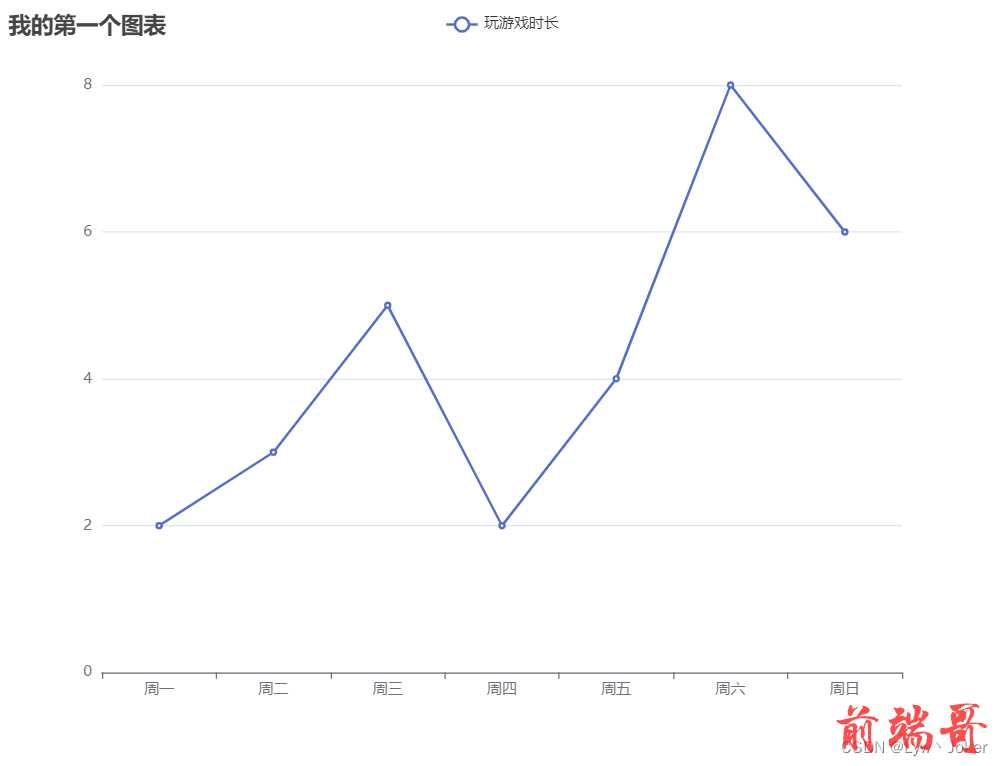
areaStyle:{fill:“#f70”} 面积图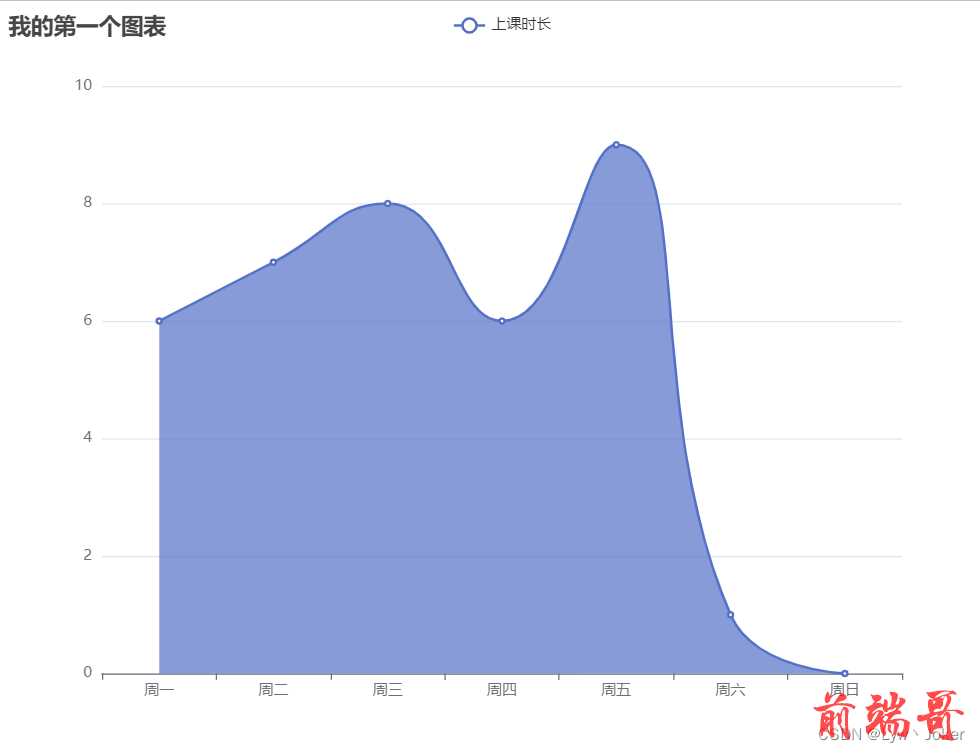
pie 饼形图

radius:[80,50] 环形图
颜色
| 主题 |
| light |
| dark |
| 自定义 |
| https: |
| color 调色盘 |
| option.color |
| color:["#55aaff","#aaff7f","#55007f","#ffff00"], |
| series.item.color |
| |
| itemStyle(项的颜色) |
| itemStyle:{color:"#f30"} |
| itemStyle:{ |
| normal:{color:"#93da6c"}, |
| emphasis:{color:"#bcff57"}, |
| } |
| 特殊样式(官网查找) |
| itemStyle:{ |
| color:linear, |
| borderRadius:[30,30,0,0] |
| } |
| |
| var linear = { |
| type: 'linear', |
| x: 0, |
| y: 0, |
| x2: 0, |
| y2:1, |
| colorStops: [{ |
| offset: 0, color: '#02bcff' |
| }, { |
| offset: 1, color: '#5555ff' |
| }], |
| global: false |
| } |
| 堆叠图 |
| stack:true |
label 标签
| show:true 是否显示 |
| position:"insideRight" 位置 |
| formatter 格式 |
| formatter:"{a}\n{c}分"} |
| {a} 系列名 |
| {b} 数据名 |
| {c}数值 |
| {d}百分百 |
| |
| rich 富文本 |
| formatter:"{big|{d}}{small|%}\n{b}", |
| rich:{ |
| big:{ |
| color:"#f70", |
| fontSize:"48px", |
| fontWeight:900, |
| 动态显示局部 |
| 定义option |
| 修改option值 |
| echart.setOption(option); |
| 更新数据和视图 |
缓动动画
| 动画延迟 |
| animationDelay: function (idx) { |
| |
| return idx * 200; |
| } |
| idx当前动画元素的下标 |
| |
| 动画时长 |
| animationDuration:function(idx){ |
| |
| return idx*200; |
| } |
| 动画缓动函数 |
| animationEasing:"bounceInOut" |
| 弹性布局 |
| |
| 事件的监听 |
| echart.on(事件名,处理函数) |
| echart.on("mouseover",e=>{}) |
| |
| 发送事件 |
| dispatch |
| echart.dispatchAction({ |
| type: 'showTip', |
| seriesIndex: 0, |
| dataIndex: ind, |
| position:"top", |
| }) |
效果图
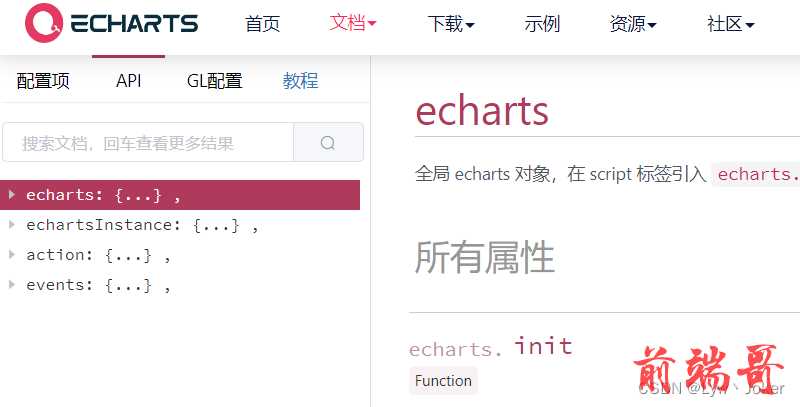
echarts官网使用
类的方法

实例方法
动作与事件
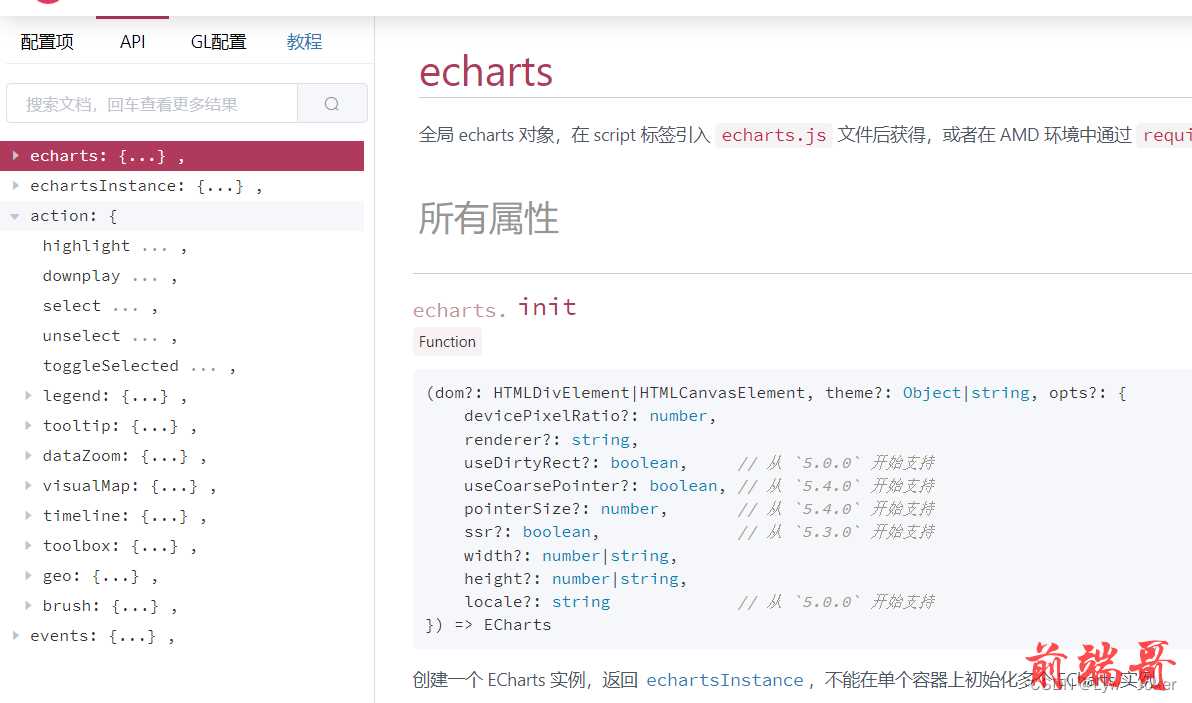
选项配置:option如何修改